Manhattan Gold & Silver has recently added some functional charts to it’s website. These new charts will show users the historical value of precious metals. The charts recently introduced include:
Each chart shows the historic price data as reported by London Fixings. The default time spans that are shown include, week to date, past 60 day, past 6 months, pas year and past 2 years. If you want to analyze a different period of time, that option is available. Enter in the dates you would like to analyze and new charts will be rendered for you to view. You can go back as far as January of 1985 to see how the prices have changed over time.
The 30 day / monthly gold chart is updated twice daily with AM and PM prices as released by the London Bullion Market.
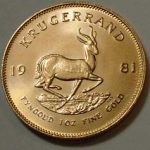
Manhattan Gold & Silver is continually expanding it’s website to offer more information about precious metal’s prices. Knowing what the price is over time, can help people to judge whether it is a good time to sell their jewelry and other precious metals. Bring in your scrap gold, or send it to us and receive fast estimates and quick payouts!